PyPlotter
-
a free Graph Plotting Library for Python/Jython
This webpage is outdated. For up to date information about CoopSim, please go directly to: https://github.com/jecki/PyPlotter/
What is PyPlotter ?
PyPlotter is an open source 2D graph plotting package for Python and Jython. It was primarily written for
use in the CoopSim
package. If you do not rely on Jython support or any other of
PyPlotter's special featurs (see key features
list below), you will probably
be better off with one of the more common Python plotting packages like
Matplotlib or ReportLab, both of which offer
much richer plotting support than PyPlotter.
Key Features
- Device Independence through a slim and easy to implement driver interface. Currently, PyPlotter supports wxWidgets, PyGTK, PyQt, tkinter, Java SWING/AWT and postscript output.
- Full Jython compatibility!
- Easy to adjust to other GUIs (such as Qt or Windows GDI) or other output devices (postscript or gif file renderers for example, which are presently supported only indirectly through wxWidgets). It should not take an experienced programmer more than half a day to write a new interface driver for PyPlotter.
- Cartesian graphs
with automatic range adjustment and automatic caption.
- Logarithmically scaled graphs.
- Simplex Diagrams, such as are used in evolutionary game theory.
Screenshot Gallery
| Click on the images to see them in full size | |
 |
 |
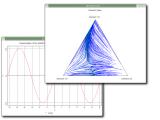
| PyPlotter
displaying a simple sine curve |
PyPlotter
displaying trajectories on a simplex diagram |
Documentation
The documentation of CoopSim is available online. You can browse the PyPlotter online documentation here.Download
| Required for PyPlotter : |
download Python 2.1 or
higher from www.python.org or download Jython 2.1 or higher from www.jython.org |
| PyPlotter Package: |
Windows
installer: PyPlotter-0.9.0.win32.exe (slightly outdated version!) |
| PyPlotter Source Code : |
Source code: PyPlotter-0.9.2.tar.gz |
| Latest Source Code | The latest source code of PyPlooter can be found as part of the CoopSim package on GitHub: github.com/jecki/CoopSim/ |
| PopulationDynamics a package for calculating population dynamics. This is in a very early state, but you may want to download it, to see some further examples of how to use PyPlotter. |
Windows installer: PopulationDynamics-0.1.0.win32.exe rpm package: PopulationDynamics-0.1.0-1.noarch.rpm Source code: PopulationDynamics-0.1.0.tar.gz Source as rpm: PopulationDynamics-0.1.0-1.src.rpm |
| CoopSim A computer simulation of the evolution of cooperation. PyPlotter has been used for this application. |
Download CoopSim from the CoopSim
Homepage. |
About
PyPlotter has been programmed by Eckhart Arnold.If you would like to contact me, please write to: eckhart_arnold@hotmail.com
Links
My personal homepage: www.eckhartarnold.deWebsite of Theoretical Philosophy in Düsseldorf: www.phil-fak.uni-duesseldorf.de/philo/
Website of the Python programming language: www.python.org
Website of Jython, the Java version of Python: www.jython.org
Homepage of CoopSim a simulation application
that uses PyPlotter: www.eckhartarnold.de/apppages/coopsim.html
Matplotlib: Very rich plotting library for Python: matplotlib.org/
ReportLab: Powerful plotting and PDF generation packet for Python: www.reportlab.org
Matplotlib: Very rich plotting library for Python: matplotlib.org/
ReportLab: Powerful plotting and PDF generation packet for Python: www.reportlab.org
back to top
Menu
FeaturesScreenshots
Documentation
Download
About
Links